
Spotlight on Gold & Silver Mining Share Indexes – Part 1

 Ronan Manly
 0 Comments
When glancing through news articles about precious metals prices, you will often come across references to the performance of various gold and silver mining stock indexes, as well as the exchange traded funds (ETFs) that are benchmarked against these indexes.
While old timers will be familiar with the XAU and HUI indexes, there are now a plethora of other gold and silver mining company equity indexes to contend with, from GDM to IMI, and from indexes maintained by MSCI, to indexes calculated by MVIS, Solactive, and Prime, to name but a few.
And with the gold and silver mining sector potentially benefitting from renewed interest in commodities / hard assets, as well as the stocks in this sector being leveraged to any gold and silver price upside, now is as good a time as any to brush up on what these indexes are all about. Incidentally, many people mightn’t know that I used to at one time manage equity portfolios at Dimensional Fund Advisors (DFA), so I’m familiar with passive funds and their indexes and factor investing.
A note about terminology. In the world of financial markets, it is correct to refer to the plural of index as either indices or indexes, so for consistency, one must be chosen, and on this occasion, I have chosen to use ‘indexes’. But ‘indices’ is equally correct. See here on the NASDAQ website for a discussion of this indexes vs indices issue.
Another note about indexes vs funds and ETFs. Sometimes in the financial markets, an index provider or a bank decides to create an index (equity index, bond index, commodity index or whatever) as they think it will be useful for capturing the performance of a sector or a set of factor returns, and following this, various funds or ETFs, in a sort of natural evolutionary way, might start to use that index as a performance benchmark.
Other times, especially more recently, the creators of a fund or ETF that’s about to be launched will decide to create a custom index against which to benchmark that new fund or ETF. This could be as to reduce tracking error, but also so as to avoid using a well-known index that might make their fund / ETF performance look worse. They also might argue that a new index is more ‘investable’ for their fund than an established index.
So in the world of financial indexes, it’s sometimes a chicken and egg situation, i.e. which came first, the Index or the ETF?
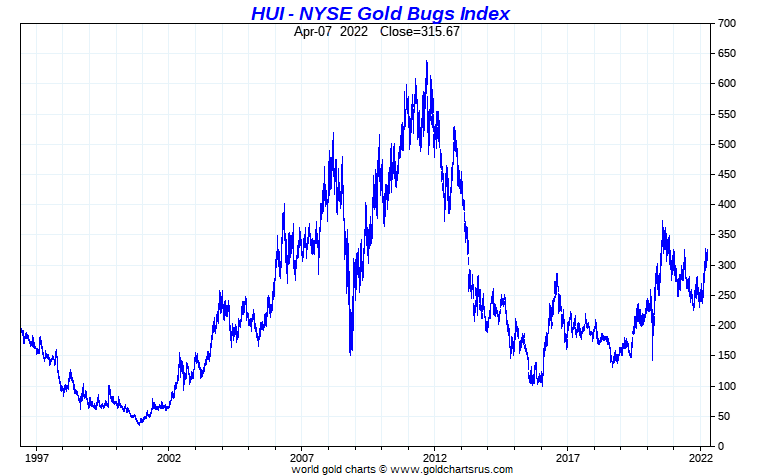
HUI – Gold BUGS
The HUI was launched in December 1996 by the American Stock Exchange (AMEX) as the AMEX Gold BUGS Index. BUGS is an acronym for – Basket of Unhedged Gold Stocks. As the name suggests, the index was launched to capture and track the performance of the equity shares of a group of listed gold mining companies which do not hedge their production (technically it is gold miners who don’t hedge their production beyond 18 months). Notably, the HUI does not include silver mining stocks.
You can see an old archived page from the AMX website from 1997 here. In 2008, when NYSE Euronext took over AMEX, the AMEX Gold BUGS Index changed ownership to the NYSE and changed name to the NYSE Arca Gold BUGS Index. Note, the ‘Arca’ comes from the fact that the NYSE acquired the Archipelago exchange in 2006 and formed NYSE Arca.
The HUI index is now owned by the Intercontinental Exchange (ICE), after ICE took over NYSE Euronext in 2013.
So today, HUI is owned by ICE, and known as the NYSE Arca Gold BUGS Index. As per its original remit, today HUI attempts to “track the performance of companies involved in the mining of gold ore that do not hedge their production beyond 1.5 years.” What the HUI is trying to do here is to make sure that the gold miners that it includes have exposure to near term movements in the gold price.
The HUI is a ‘modified equally weighted’ index, its eligible securities are limited to US listed stocks or American Depository Receipts (ADRs), and the index has quarterly reconstitutions (i.e 4 times a year companies can be kicked out or added to the index). ‘Modified equally weighted’ here means that all eligible stocks are ranked high to low by free-float market cap (MCAP) and then the two largest get a 15% weighting each, the third largest gets a 10% weighting, and all the rest share the remaining 60% of the weighting equally.
HUI rules and methodology can be seen here.
Back in the 1990s there were about 18 gold mining stocks in the HUI. Today, there are 24. The components can be seen in XLS format here. All the big and well-known names are components in the HUI such as Newmont, Barrick, Franco Nevada, Gold Fields, Harmony, Eldorado, Royal Gold, Agnico, etc. etc.

XAU – From Philadelphia
The other ‘famous’ precious metals mining stock index is the XAU, which is officially called the Philadelphia Gold and Silver Index. As per the name, this index was created by the Philadelphia Stock Exchange (PHLX). However, in 2007, NASDAQ acquired PHLX, and also the same year NASDQAQ merged with OMX. So now the PHLX is called NASDAQ OMX PHLX. You can see an old imprint of the PHLX website here from 2007 which lists the XAU as one of the tickers on the left hand frame.
XAU was launched in January 1979, so has been around for an impressive 43 years so far. XAU is a modified capitalization weighted index, and as the name “Philadelphia Gold and Silver Index” suggests, its components are drawn from the equities of exchange listed gold and silver mining companies. There are currently 30 gold and silver mining company stocks in the XAU, a list of which can be seen here.
Eligible securities for inclusion in XAU are mostly common equities and ADRs, and securities have to be listed on one of four US based exchanges, namely NASDAQ, NYSE, NYSE American or CBOE BZX Exchange (BZX = formally BATS). The minimum market cap (MCAP) of a stock for potential inclusion in XAU is at least US$ 100 million. XAU is rebalanced 4 times a year in March, June, September and December.
Due to some of the precious metals miners having very large MCAPs and to prevent then dominating the index, the XAU has a bunch of rules to limit the maximum weight of a component, and the weighting calculations iterate through various stages starting with 1) get the weight of each component by dividing its MCAP by the combined MCAP of all the components, and then 2) limit the 5 largest names to a max weighting of 8% each and all other components to a max 4% weighting each.
Beyond this, there are a whole lot more parameters and rules around capping the component weights. For those interested, the index construction methodology of the XAU can be seen here.
Well known component stocks of the XAU include large and medium sized gold miners such as Barrick, Eldorado, Harmony, Newmont, Gold Fields, Seabridge, AngloGold Ashanti, and Kinross, and the large primary silver miners such as First Majestic, Hecla, Coeur, and Pan American. Basically the XAU is a who’s who of all the very well known gold and silver miners which have listings on US exchanges.
I first came across the HUI and XAU in about 2001 after the internet stock bubble had burst and when gold and silver mining stocks were beginning to take off. I remember back then reading commentary and charts about the HUI and XAU from Adam Hamilton at ZEAL.
Beyond HUI and XAU there are many other precious metals indices. Let’s take a look.
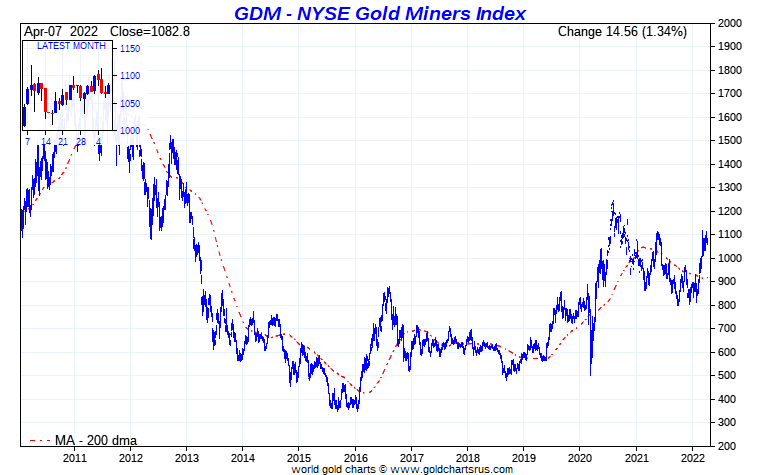
NYSE Arca Gold Miners Index
Many readers will be familiar with the giant Van Eck Gold Miners ETF (ticker GDX), an ETF which has assets of about US$ 15.3 billion.
GDX is an index tracker and aims to track the performance of an index called the NYSE Arca Gold Miners Index (GDM), or in the words of Van Eck, GDX “seeks to replicate as closely as possible, before fees and expenses, the price and yield performance of the NYSE Arca Gold Miners Index”.
Like the NYSE Arca Gold BUGS Index (HUI), the NYSE Arca Gold Miners Index is owned and maintained by Intercontinental Exchange (ICE), specifically ICE Data Indices.
The NYSE Arca Gold Miners Index (whose ticker is GDMNTR but we’ll call it GDM) measures the performance of the publicly listed equity (stocks) of the ‘larger’ capitalization primary gold and silver mining companies worldwide (mostly miners but some streamers). So GDM is a global index. The GDM methodology document refers to the eligible universe of potential index components as ‘highly-capitalised’ gold and silver miners, and it sets a minimum MCAP of $750 million (not free float adjusted) for any stock to be eligible for inclusion in the index, as well as various average daily trading metric minimums. Eligible securities of GDM include common equity, ADRs, and Global Depository Receipts (GDRs) listed on US or Canadian exchanges.
GDM currently has 56 component stocks from the very large such as Newmont, Barrick Franco-Nevada, Newcrest, Kirkland Lake, and Goldfields, down to mining companies with the smallest index weights such as Westgold Resources and Argonaut Gold. All the large North American listed primary silver mining companies such as First Majestic, Hecla, Coeur and Pan American are also components of GDM.
The index is a modified market cap weighted index and has a set of rules to try to limit the weights of the very large gold miners, so as to prevent them dominating the index and to provide more diversification potential among the other components.
Still, Canadian listed companies dominate the country weightings with a whopping 43%, highlighting the powerhouse which is the Canadian listed resource sector. This is followed by the US, with a 20% weighting and Australia with a 13% weight. Together the top 10 holdings of the index represent over 60% of the total weight, meaning that the price movements of these handful of major gold mining companies will have a very large influence on the index and the GDX ETF.
While the GDM index has an inception date of 1 October 2004, the Van Eck Gold Miners ETF (ticker GDX) was launched in May 2006, and it may have been the case that the GDM index (NYSE Arca Gold Miners Index) was created specifically for the Van Eck GDX ETF to track it, but that it was calculated back to 2004 just to provide index data for GDX to align with.
The NYSE Arca Gold Miners Index methodology document can be seen here.

MVIS Global Junior Gold Miners Index
Staying with the ETF provider Van Eck, Van Eck also offers a well-known ETF called the “VanEck Junior Gold Miners ETF (GDXJ)”, which tracks an index called that “MVIS Global Junior Gold Miners Index”. GDXJ has assets of about US$ 5 billion.
Van Eck says that GDXJ “invests in the stocks of small gold miners, some of which are in the early stages of exploration”. So it includes both precious metals producers and explorers. More than 50% of the stocks in GDJX are classified as ‘Canadian’ (i.e. GDXJ holds the Canadian line of the stock), a fact which highlights the powerhouse of the Canadian resource sector. The second highest country concentration is Australia, making up 17% country weighting.
The MVIS Global Junior Gold Miners Index has a ticker MVGDXJTR – the TR meaning Total Return. Let’s call it “MV GDXJ”.
The GDXJ ETF was launched in November 2009, and the MVIS Global Junior Gold Miners Index has an inception date of 31 August 2009, so this looks like a clear case of the index having been created specifically for the Van Eck GDXJ ETF to track.
The MVIS Global Junior Gold Miners Index is calculated and maintained by a German company called MV Index Solutions, whose head office is in Frankfurt, and which is a wholly owned subsidiary of Van Eck. Incidentally, Van Eck’s European headquarters is also in Frankfurt.
On its website, MVIS says that the MVIS Global Junior Gold Miners Index “tracks the performance of the most liquid small-cap companies in the global gold and silver mining industries”.
“MV GDXJ” is a “modified market cap-weighted index”, and “only includes companies that invest primarily in gold or silver, generate at least 50% of their revenue from gold or silver mining”. The minimum MCAP for inclusion in the index is a gold or silver miner with a market cap of at least US$ 150 million and there are also various trading liquidity minimums for eligibility. The index is rebalanced quarterly, and currently has 97 gold and silver miner stock components, which can be seen here. The max weight per stock component is capped at 8% and the largest weights currently are in Pan American Silver (5.52%), Yamana Gold (5.21%) and Evolution Mining (5.13%).
With both GDX and GDXJ popular among precious metals investors who also want exposure to the gold and silver mining sector, its good to at least know what GDX and GDXJ are investing in.
Solactive Indexes
Next up is the Solactive Gold Miners Custom Factors Index. Solactive is a German financial index provider, and like MVIS, it is headquartered in Frankfurt. If you haven’t heard of Solactive or the Solactive Gold Miners Custom Factors Index, you probably have heard of the Sprott Gold Miners Exchange Traded Fund (ticker SGDM) which tracks the Solactive Gold Miners Custom Factors Index.
According to Sprott, the Solactive Gold Miners Custom Factors Index (ticker (ticker SOLGMCFT but let’s call it SOLGM) “aims to track the performance of larger-sized gold companies whose stocks are listed on Canadian and major U.S. exchanges.”
According to Solactive, the SOLGM index aims to “track the price movements of a portfolio of gold mining companies, that are weighted according to a rules-driven model where gold mining companies with strong fundamental data are rewarded and those with weak fundamental data are penalized.”
Here’s a recent pdf fact sheet for the SOLGM index here. As the name suggests, this index only contains gold mining companies and not primary silver miners. There are 33 names in the index right now, the largest weights being Barrick and Newmont (both with 13% weights), followed by Franco Nevada (10%), Wheaton, Royal Gold, Yamana, and Agnico, which in total represent about 58% of the total weight of the index.
Sprott says that SGDM and the index SOLGM take into account ‘Factors that Matter’ which have been jointly designed by Sprott and Solactive and which appear to be a proprietary way of tweaking the stock selection and weights of the gold mining stocks with an overlayed multi-factor approach. Classical Eugene Fama and Ken French factors are such things as size (small vs large) , value (growth vs value) and sometimes momentum, and while Sprott doesn’t talk too much about what factors it takes into account, it does say that its “customized factors are selected because they have historically proven to be strong predictors of stock performance, and include fundamental metrics such as revenue growth, long-term debt-to-equity and price momentum.”
Very quickly, there is also a Solactive Junior Gold Miners Custom Factors Index (ticker SOLJGMFT) which another Sprott ETF, called the Sprott Junior Gold Miners ETF (SGDJ) tracks. This index aims to track “the performance of small-capitalization gold companies whose stocks are listed on regulated exchanges”, and targets stocks with an MCAP range of between US$ 200 million and US$ 2 billion. Like the Solactive large cap gold miner ETF, the junior version also overlays a factor approach on such things as revenue growth and price momentum.
There are currently 37 stocks in the SGDJ, and interestingly, about 39% of the component stocks are Australian juniors, about 39% are Canadian listed juniors, and about 13% are UK listed juniors. The largest components of the index are Aurelia Metals (Aus), Pan African Resources (UK), Skeena Resources (Can), Eldorado Gold (Can), Wesdome Gold Mines (Can) and Westgold Resources (Aus). A recent pdf factsheet for the index can be seen here.
Conclusion
The above gives a quick rundown on the well-known HUI and XAU, as well as the indexes (NYSE Arca and MVIS) behind the Van Eck GDX and GDXJ ETFs, and the Solactive indexes behind the Sprott gold miners and gold junior minors ETFs.
While that’s quite enough indexes to take in in one go, there are plenty more, so part 2 of this article will look at a few such as the MSCI ACWI Select Gold Miners Investable Market Index, the US Global GO GOLD and Precious Metal Miners Index, the Barron’s Gold Mining Index (BGMI), and maybe some country specific precious metals mining indexes such as on Canada’s TSX, South Africa’s JSE and the Aussie ASX.
For the silver surfers and silver foxes, Part 2 will also look at some silver mining indexes from Prime (Prime Junior Silver Miners & Explorers Index), Solactive (Solactive Global Silver Miners Index) and MSCI (MSCI ACWI Select Silver Miners IMI Index).
Part 2 will also look at the fact that investing in precious metals mining shares or gold and silver mining ETFs is not the same as holding the physical precious metals, and that even if you diversify away stock specific risk by holdings a basket of precious metals mining shares, you are still left with the sectoral risk. But that may not be a bad thing, if you believe that gold and silver prices are going to go a lot higher.
If anyone has suggestions of other gold and silver mining indexes to include in Part 2, please add a suggestion in the Disqus comments below.
Popular Blog Posts by Ronan Manly
 How Many Silver Bars Are in the LBMA's London Vaults?
 ECB Gold Stored in 5 Locations, Won't Disclose Gold Bar List
 German Government Escalates War On Gold
 Polish Central Bank Airlifts 8,000 Gold Bars From London
 Quantum Leap as ABN AMRO Questions Gold Price Discovery
 How Militaries Use Gold Coins as Emergency Money
 Hungary Announces 10-Fold Jump in Gold Reserves
 Planned in Advance by Central Banks: a 2020 System Reset
 China’s Golden Gateway: How the SGE’s Hong Kong Vault will shake up global gold markets